You can get free access to our Bookmap Gold via our Youtube Channel @BookmapGoldMY.
Please refer to this detailed information.

- Gold futures price at current time. The price has some delay (around 5 to 10 seconds) due to painting of other data in Bookmap such as hitmap and streaming delay. For faster streaming and another useful indicators such as Iceberg & Stop tracker, please register at our main page.
- Short Term High Liquidity (STHL) zone. Temporary liquidity, normally no more than 1 hour. Early indicator that price can move up (if it appear above current price) or down (if appears below current price). Act as short term supply/demand zone.
- Long Term High Liquidity (LHTL) zone. Can act as strong support/resistance zone if it appears in big order (volume more than 100). Breakout or pullback can happen in this zone. Watch for price action if price reaches this zone.
- Volume Weighted Average Price (VWAP). Similar to moving averages, with take volume into the calculation. Act as dynamic support/resistance.
- Point of Control (POC). Indicates the level where most order was traded. We use Daily timeframe as our base calculation.
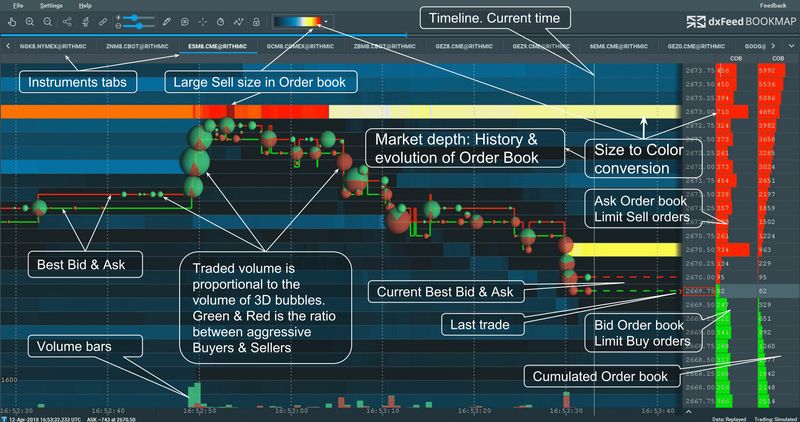
- Current Order Book (COB). Pending order sizes at certain price point.
- Session Range Value Profile. Volume + Session range accumulated displays traded volume for the entire session. Reflects the traded volume on the particular price scale. By default, the number displayed represents both buy and sell contracts.
- Session Range Trades Counter (STC). Trades counter + Session range accumulated displays the number of transactions that occurred at each price level.
- Chart Range Quotes Counter (CQC). Quotes counter + Chart range accumulated shows the number of size updates at each specific price level, displayed by Session Accumulation. It is useful for monitoring traders’ activity at a specific price level.
- Cumulative Volume Delta (CVD) displays the cumulative volume changes based on the volume traded by sell aggressors versus buy aggressors and is displayed on the indicator and widget pane.
- CVD in chart display.
Bookmap uses Gold futures data, while trading platforms (MT4/TradingView) uses Gold spot (XAUUSD).
Learn more about futures vs spot here.
First, get latest price from Bookmap (eg. 1950).
Then, get latest price from trading platforms (MT4/TradingView) (eg. 1940).
The difference is 10 (1950 – 1940).
So, if you’re seeing high liquidity zone in Bookmap eg 1960, you will need to subtract it by 10. In your trading platform, you will need to mark at 1950.
Please note that this price difference could be different for each day.
We directly stream data from Bookmap to Youtube. The price has some delay (around 5 to 10 seconds) due to painting of other data in Bookmap such as hitmap and streaming delay. For faster streaming and another useful indicators such as Iceberg & Stop tracker, please register at our main page.
Register at our main page and make deposit minimum USD $100 to your ECN.Broker account. Contact our admin if you were not added to the live stream automatically.

On Telegram, open TuahDC.com Bookmap Gold + Iceberg Indicator group. Then, click on join live button.
We directly stream data from Bookmap to Telegram. Technically, streaming to Telegram is faster than Youtube because of no processing on Telegram side. Expected delay is less than 5 seconds.

- Number with blue icon indicates executed Iceberg order. More information here.
- Number with red icon indicates executed Iceberg order. More information here.
- Number in white indicates liquidity marker. Aggregated markers display both the total liquidity and the number of aggregated markers. For example, “112/3” indicates that the liquidity changed by 112 and that there were 3 individual changes that were aggregated into one marker.
- Passive Seller absorption indicator. In many cases, the absorption indicates areas where price bounces and moves in a new direction. Please refer here for more information.
- Passive Buyer absorption indicator. In many cases, the absorption indicates areas where price bounces and moves in a new direction. Please refer here for more information.
- TTW Trend Analyzer – Buy.
- TTW Trend Analyzer – Sell.
Register at our main page and make deposit minimum USD $100 to your ECN.Broker account. Contact our admin if you were not added to the live stream automatically.
There are 3 main components in the dashboard that can help traders placing their position in the market.
- Currency Strength Meter: This is a powerful tool that can help traders screen their best currency pair to trade with. Normally we pick strongest vs weakest pair and place our position on the instrument.
- BBMA Dashboard: BBMA (Bollinger Bands Moving Average) Dashboard is a trading setup that displays position suggestion for entry in the dashboard based on BBMA setup. There is a signal entry in the Telegram group for others to follow.
- Trend Analyzer: Displays trend for various timeframes for popular pairs including XAUUSD, XTIUSD, Dow Jones (US30), Nasdaq (USTEC), and S&P (US500) indices.
- Economic Calendar: Stay alert on big impact news that can affect trading session.
On Telegram, open TuahDC.com Trading Tool Indicator group. Then, click on join live button.
We directly stream data from Dashboard to Telegram. Technically, streaming to Telegram is faster than Youtube because of no processing on Telegram side. Expected delay is less than 5 seconds.